
41.94% Result Rate for Pennies using Video Ads on Facebook!
Normally I can’t share fresh campaign data due to client NDAs — however, in this case I’m partners in a project and showing you our metrics is fair game!
So here’s a demonstration of how you can use micro-budget campaigns to test new marketing concepts before rolling out into broader ad spend…
The Channel of Choice
One of the most powerful methods for testing new campaign ideas, creative concepts, headlines and audience demographics is through the Facebook Advertising platform.
See the screenshot below showing results for 7 video adverts run for just a few days.
The goal is to determine the best cost/engagement ratio for video views. The column most noteworthy is for ‘Relevancy’ on the far right showing the numbers, 6, 7, 8.
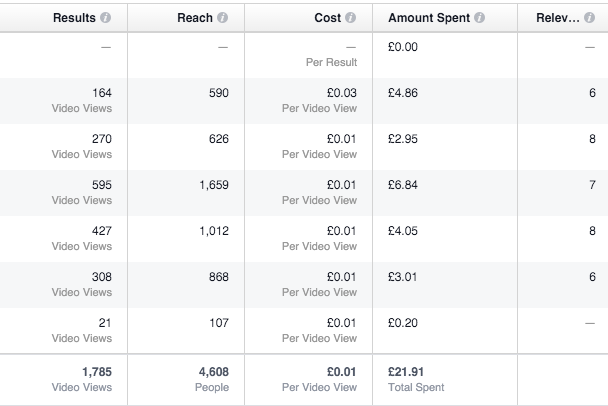
Relevancy is Facebooks assessment of how engaging each advert is for the targeted audience out of a maximum possible score of 10.
Facebook’s algorithm calculates the Relevancy Score once an advert has received 500 impressions, or ‘Reach’.
This means we can run simultaneous test ads with 500 impressions each to gauge how well the ad would perform on a larger budget to the same audience profile.
Cherry-Pick The Sweetspot Of Your Audience
If you’re unfamiliar with how granular Facebook audience targeting can be, here’s an example:
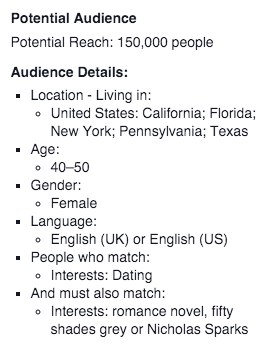
That’s 150k women age 40-50 living in one of those 5 major US cities who are interested in dating and also interested in romance novels…
Keeping It Relevant Reduces Ad Costs
Achieving a high relevancy score also means that Facebook will, over time, charge you less per view or click as they reward you with lower ad costs the more you support a positive user experience for Facebook members. Think about it.
Keep It Simple
I didn’t run all 7 ads at once. That would be overkill. Best to test 2 or 3 concepts at a time and then refine and advance based on results.
The first adverts I ran hit a 6 and a 7 for Relevancy. That gave me direction for the next mini-test (each taking less than a day to run) and so I hit another 6 plus two 8’s.
The next test will focus on the similarities and differences between those adverts to help identify new ideas to test and increase the Relevancy score as much as possible for this particular campaign and audience.
How well does this correlate with click-through rate?
Just 0.5% CTR on one of the original concepts with a massive increase hitting 4% CTR for the best performing ad.
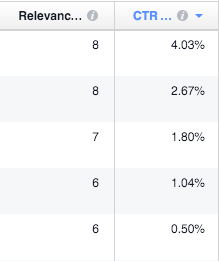
I’m not saying you need to get a Relevancy Score of 8 or that you’ll then see a 4% average CTR. Just that the correlation of Relevancy with CTR is demonstrably evident. My goal for this campaign is Relevance Score 9 with 8% CTR.
Such metrics are always useful for presenting to budget approvers, in team meetings and end of month results meetings. Especially when you show highly cost-efficient due diligence of innovative new marketing concepts to build support for bigger budget approvals.
In this way we can validate ideas for new marketing campaigns. And while it’s still early days on this particular campaign, it’s gratifying to see CTR go up 706% within just a few days, 2 test iterations and pocket change.
Facebook Is The Perfect Channel For Testing
Below includes a column for ‘Result Rate’ which in this case is the percentage of people who watch at least 10 seconds of the video advert once it shows up on their Facebook News Feed.
+40% of people watching more than 10 seconds of an ad that is costing pennies to deliver shows the incredible opportunity of Video Advertising on Facebook today.
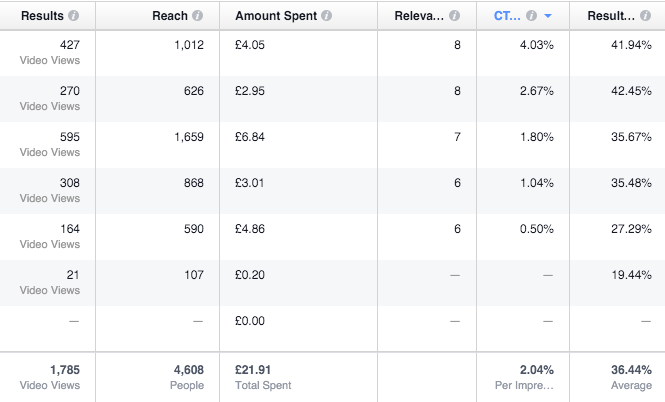
And here shows the reduction in overall Cost Per Click with increase in Relevancy, CTR and Result Rate.
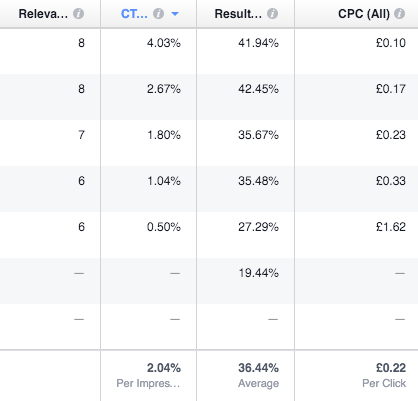
From £1.62 CPC down to £0.10 CPC. A 93.8% reduction!
Could that difference turn a highly unprofitable campaign into a profitable one? Of course…
Next steps for this campaign is to start tracking it from the click through to confirmed lead generation (and therefore measure Cost Per Lead). Brand engagement can be tracked in various ways although I prefer measuring opt-in rate as a KPI for brand engagement for trackable campaign funnels.
From there I can track individual ads through to sales and thereby calculate ROI down to the penny.
But where to focus?
If you’ve ever seen a car mechanic tighten the bolts on a wheel you’ll see he rotates around them, tightening them a little each time.
Why? Because if he tightened one of the bolts fully without ensuring the others are aligned, he might actually get the bolt stuck rather than securely fastening the wheel.
And it’s the same with campaign testing.
With the above results I can introduce elements from winning ads into the landing page and subsequent email nurture campaigns leading to sales.
However: We don’t want to invest lots of time and effort across all parts of a conversion funnel while still establishing what works best for a particular campaign (including segmentation, offer, headlines, etc).
Update: On the next round of micro-tests the campaign has achieved Facebook’s highly coveted maximum Relevancy score of 10, with a 8.59% click-through-rate at just 0.13 average cost per click! Time to optimize the next step in this sales funnel.
![]()
Your Next Steps
It’s so easy to start testing concepts and exploring ideas, hunting for the next blockbuster winner that could become key to your growth strategy in the year ahead.
If you don’t have the expertise or capacity in-house for this type of project, and would like to get the ball rolling with minimal effort, I can create campaigns that meet your brand guidelines and get them running for you very fast. Most likely for far less investment in resource or ad spend than you would get in-house or with a traditional agency.
Send an enquiry today and let’s find a few winning concepts that you can roll-out across your marketing.